Insights
Dashboard
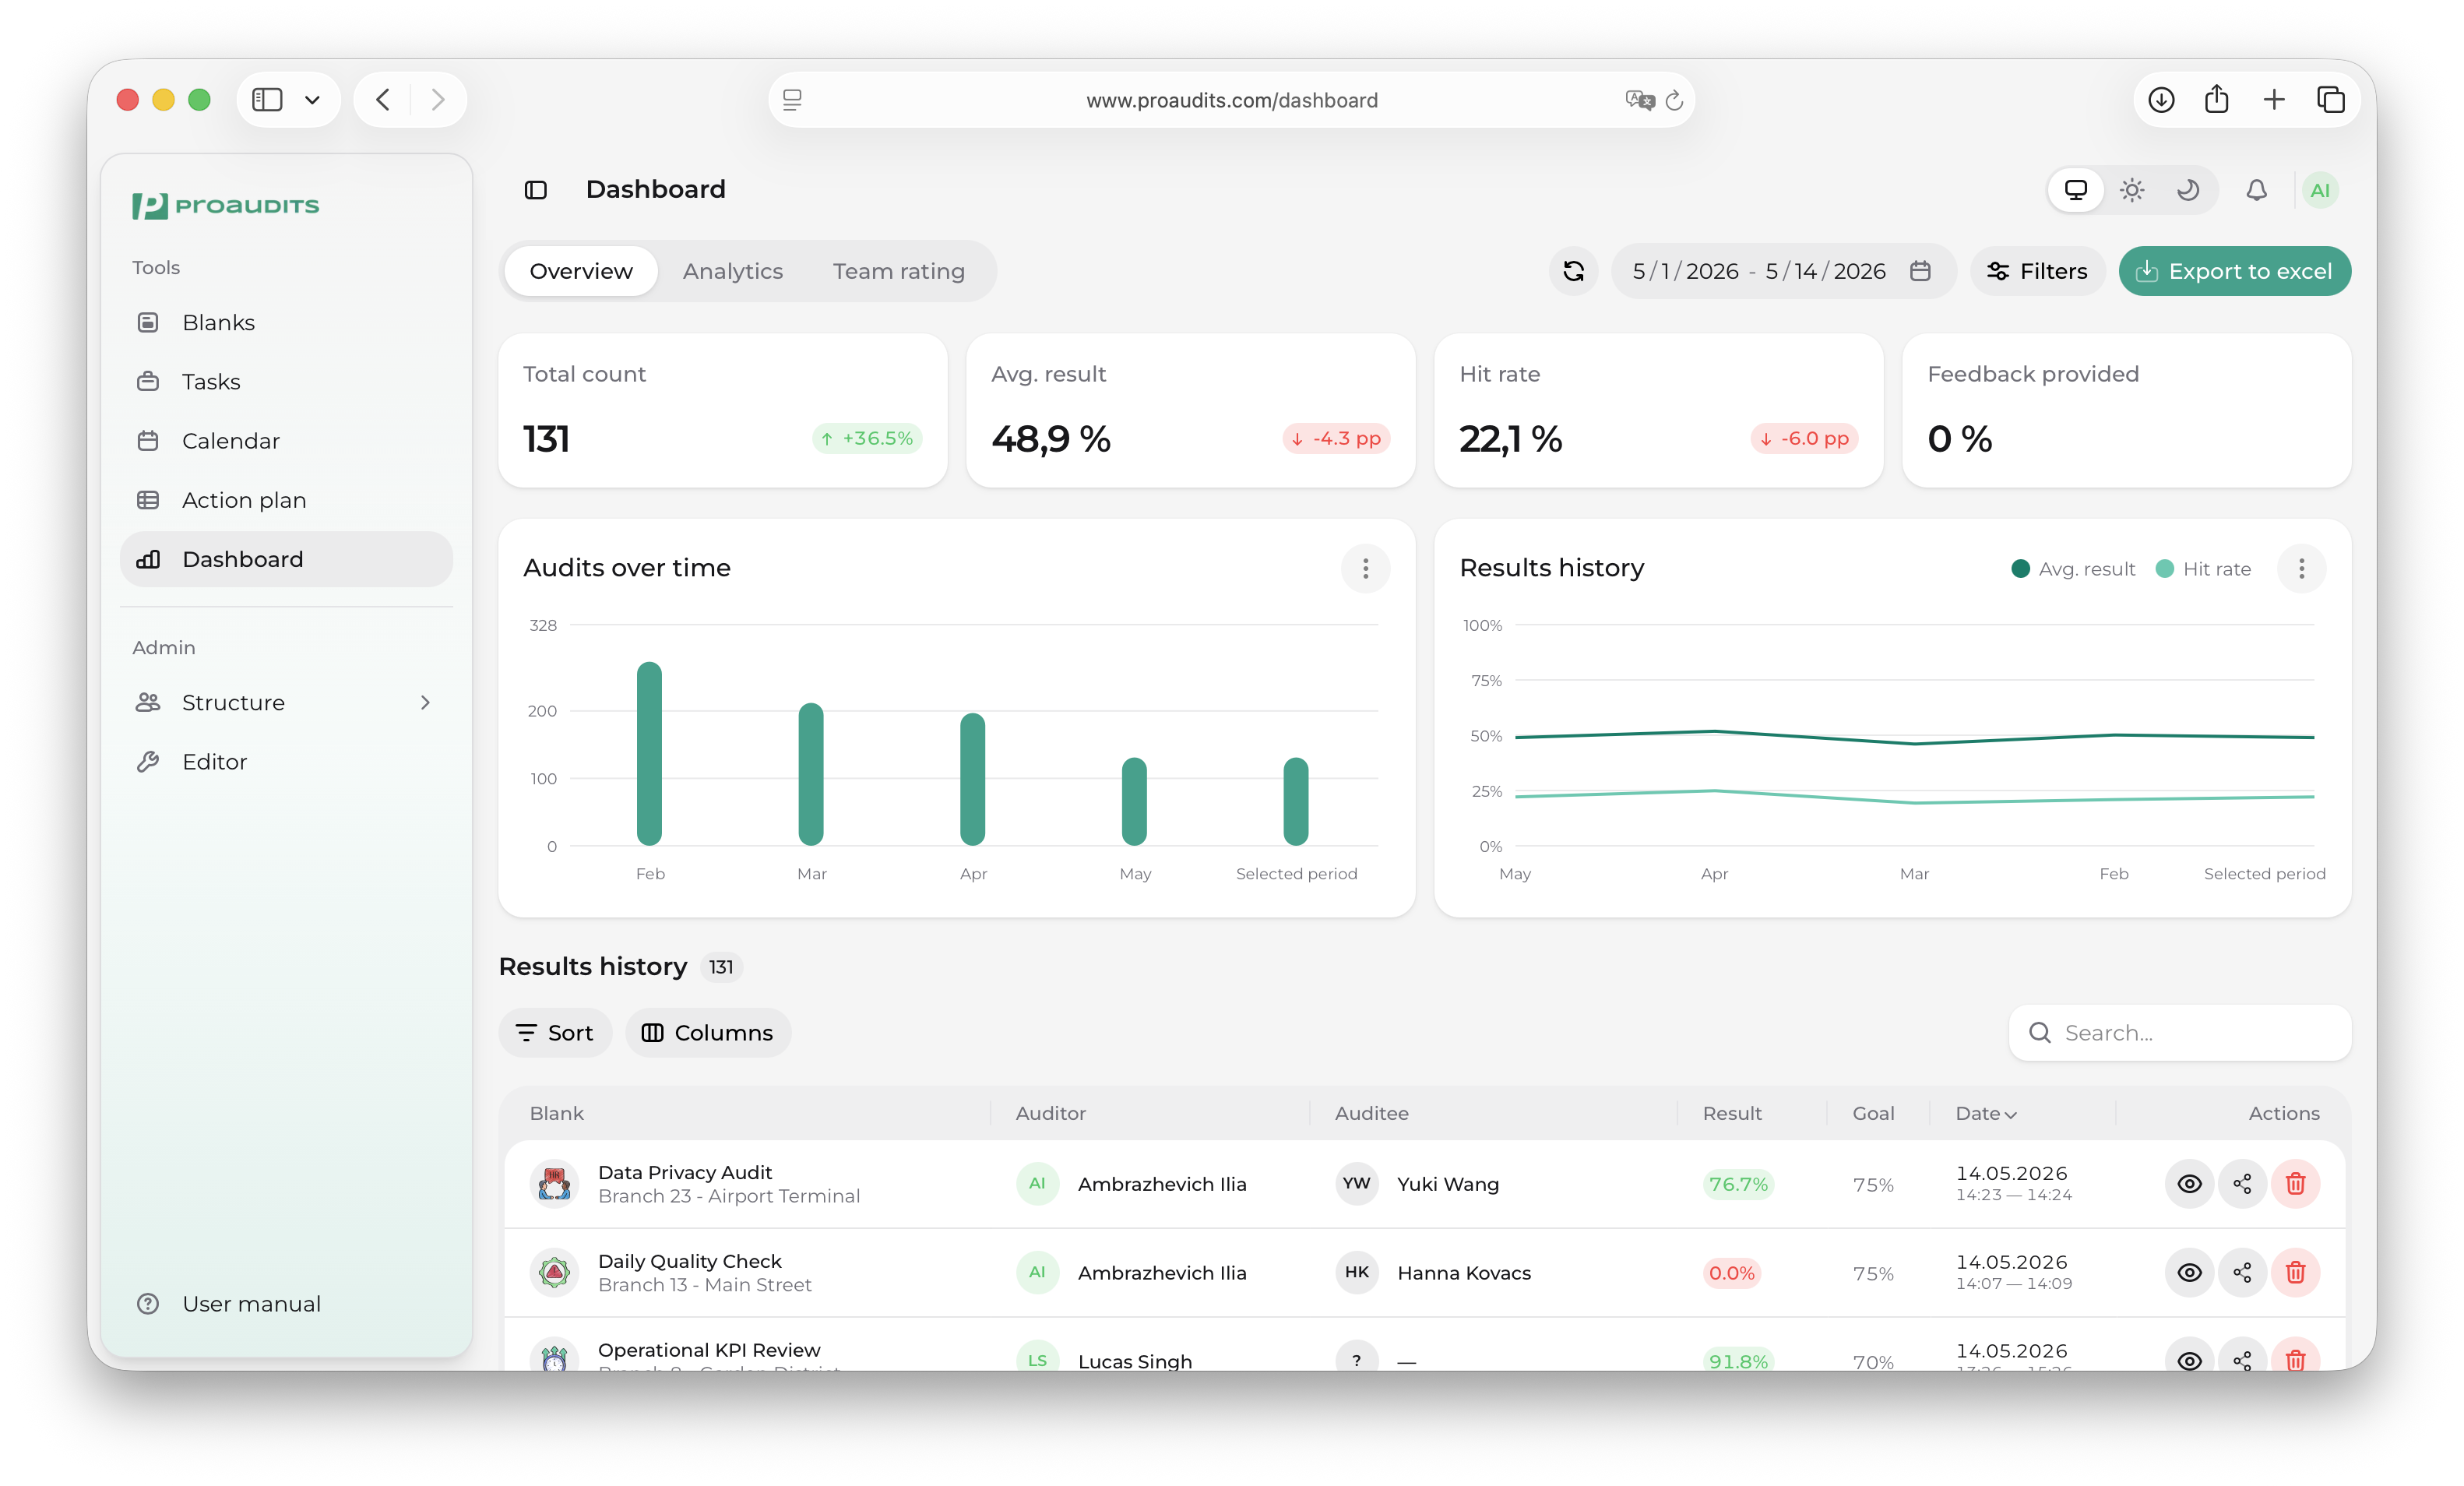
The Dashboard is where the numbers live. It rolls every audit into KPIs, trends, and rankings — the view managers open with their morning coffee.
Dashboard — overview

Three tabs
A tab strip at the top of the page switches between three angles on the same data:
- Overview — the headline KPIs, two trend cards, and the audits history table. The default landing tab.
- Analytics — deeper breakdowns by process and item group, plus the top-issues table.
- Team rating — the leaderboard of how individual auditors and locations are scoring.
The store / period filters in the toolbar apply to every tab — switch tab and the same filter stays active.
The KPI strip
Across the top of the page sits a row of compact KPI cards with the headline numbers for the current filter:
- Total count — how many audits finished in the selected period.
- Avg. result — the weighted average result, as a percentage.
- Hit rate — the share of audits that met or beat their goal.
- Audit feedback provided — the share of finished audits where the auditee left a feedback reply.
KPI strip
Filtering
The filter sheet — opened from the filter button in the toolbar — narrows the whole dashboard at once.
Dashboard filters
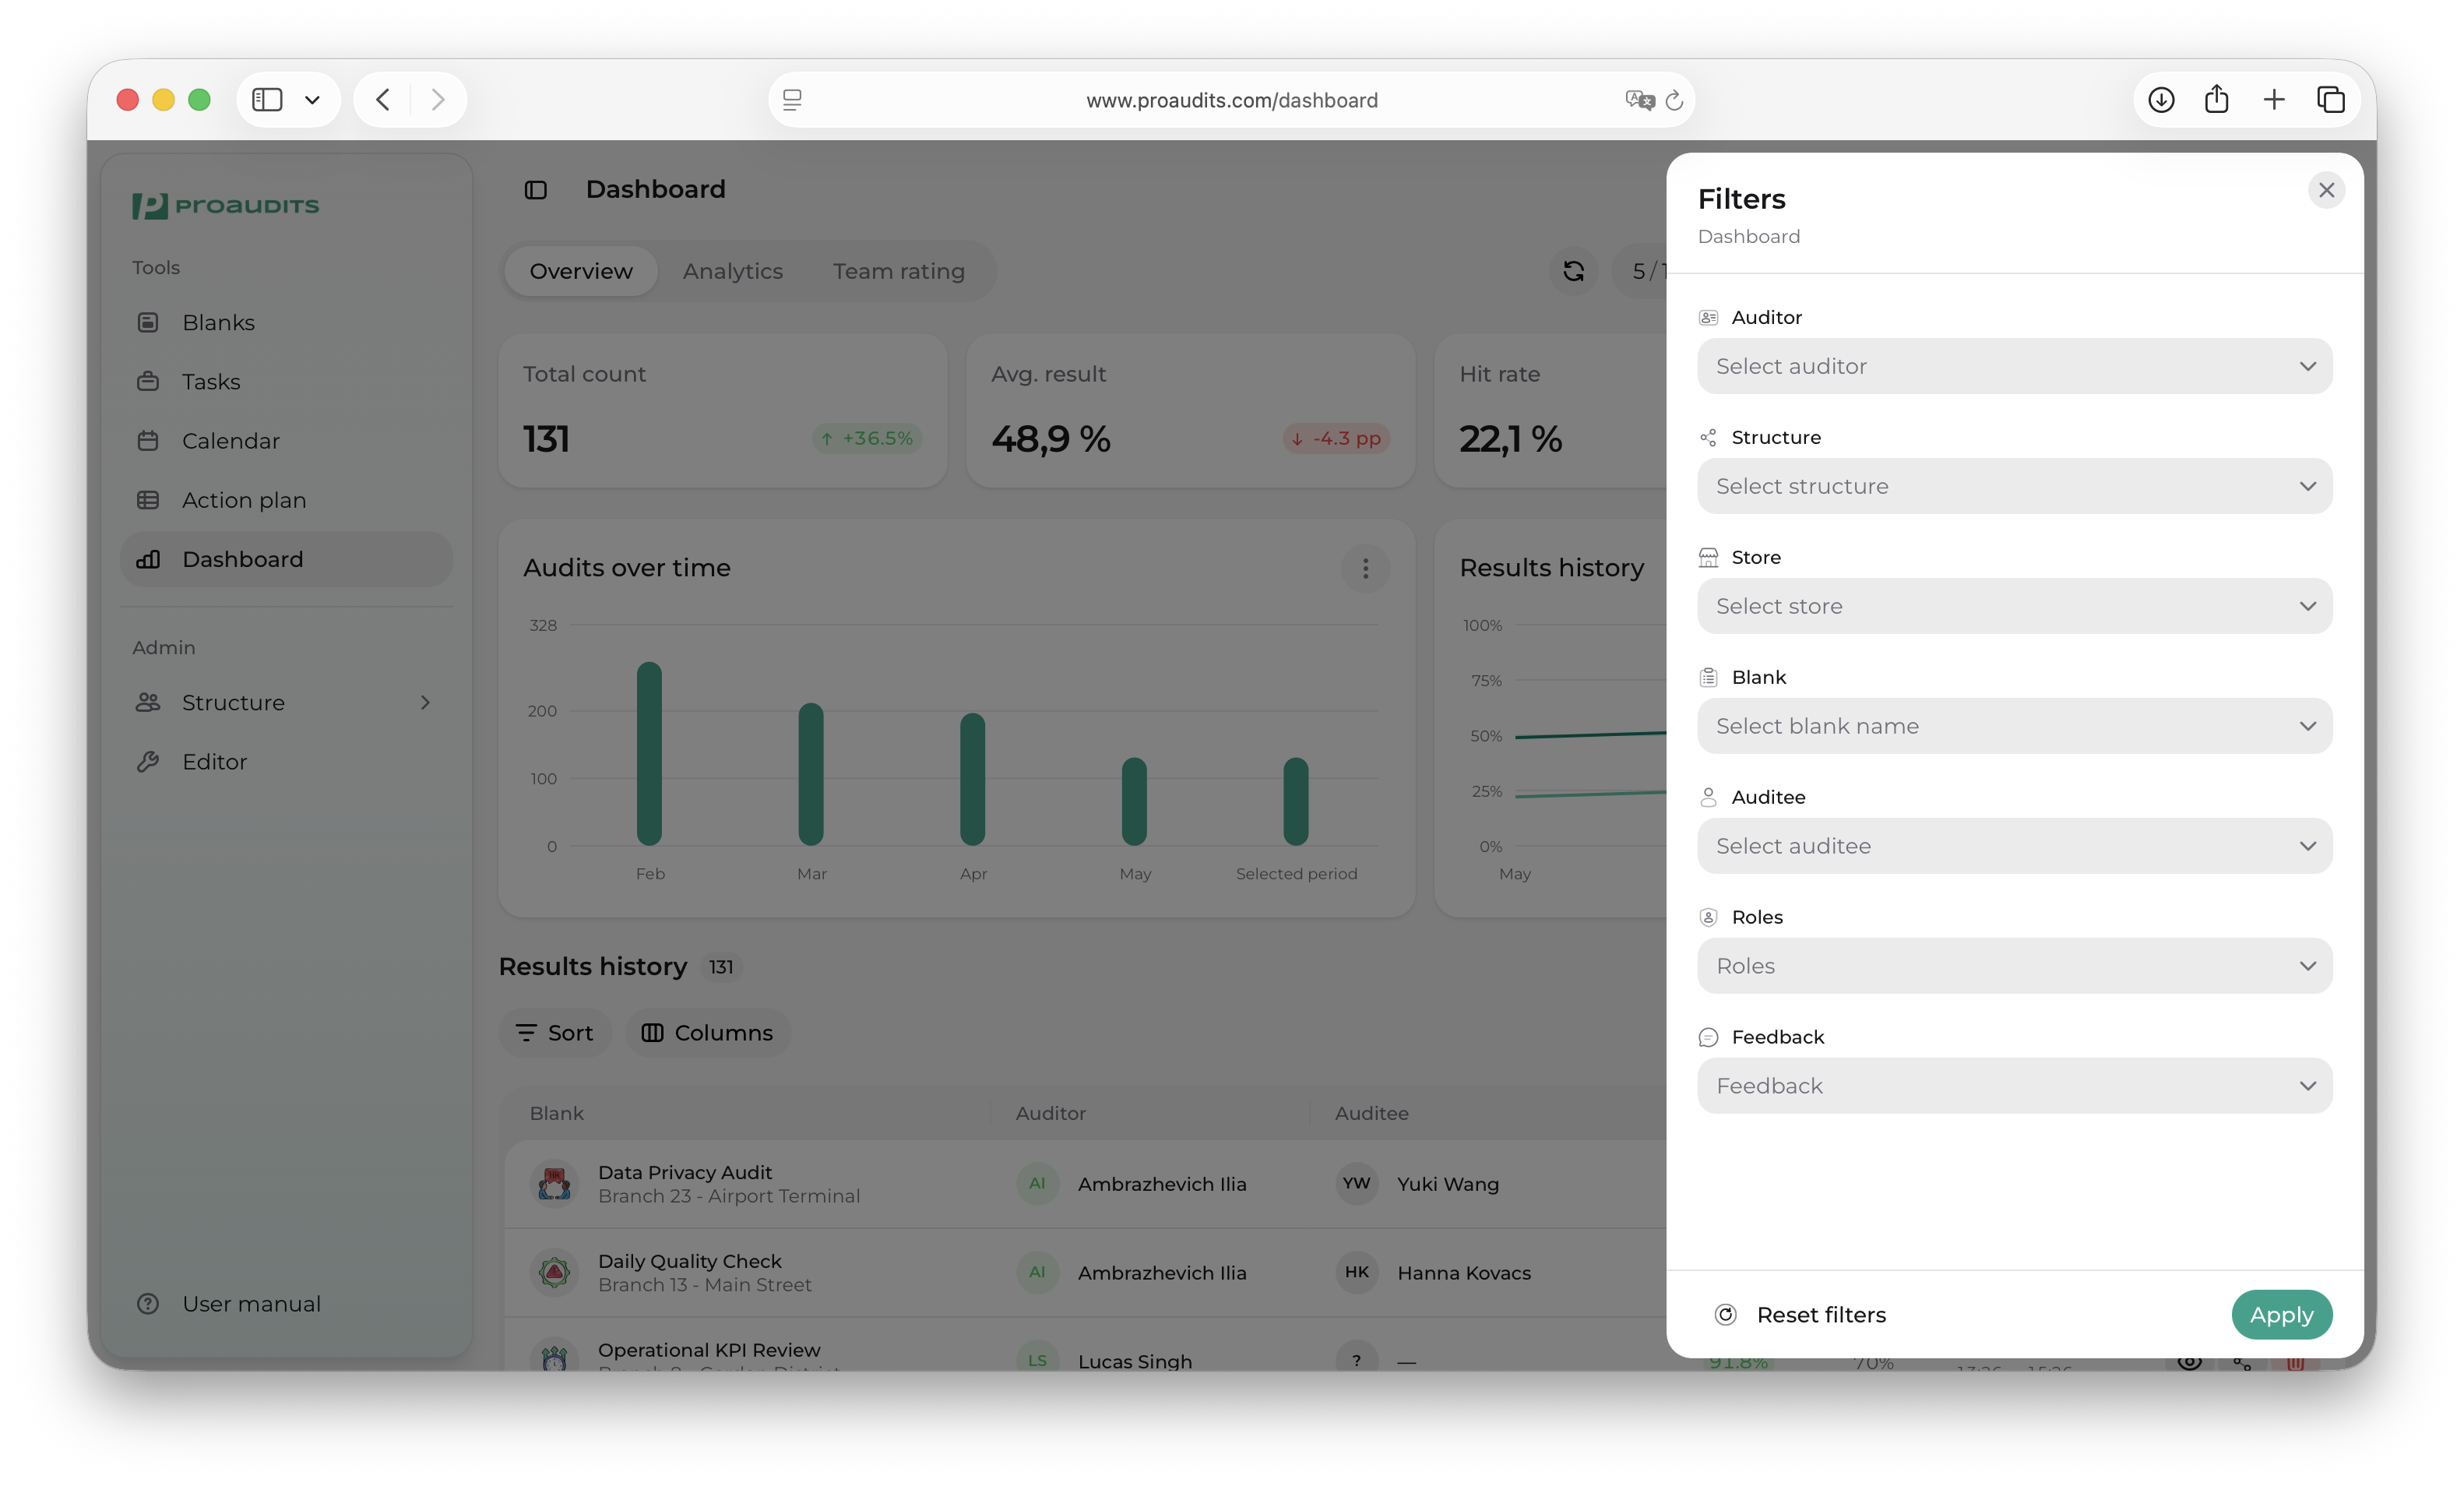
You can scope by:
- Period — preset (last 7 days, last month, this year…) or a custom range.
- Structure unit or store — narrow to a region, a city, or a single location.
- Process — focus on one category of audit.
Overview tab
The default tab — fast scanning of the period.
Audits per period
A bar chart of audit volume over time, comparing your selected period against a reference period (usually the same length immediately before it). Useful to confirm visit cadence is on plan.
Audits per period

Results history
A line chart with two series — Avg. result and Hit rate — plotted over the period. Hover any point for the exact day's numbers.
Results history

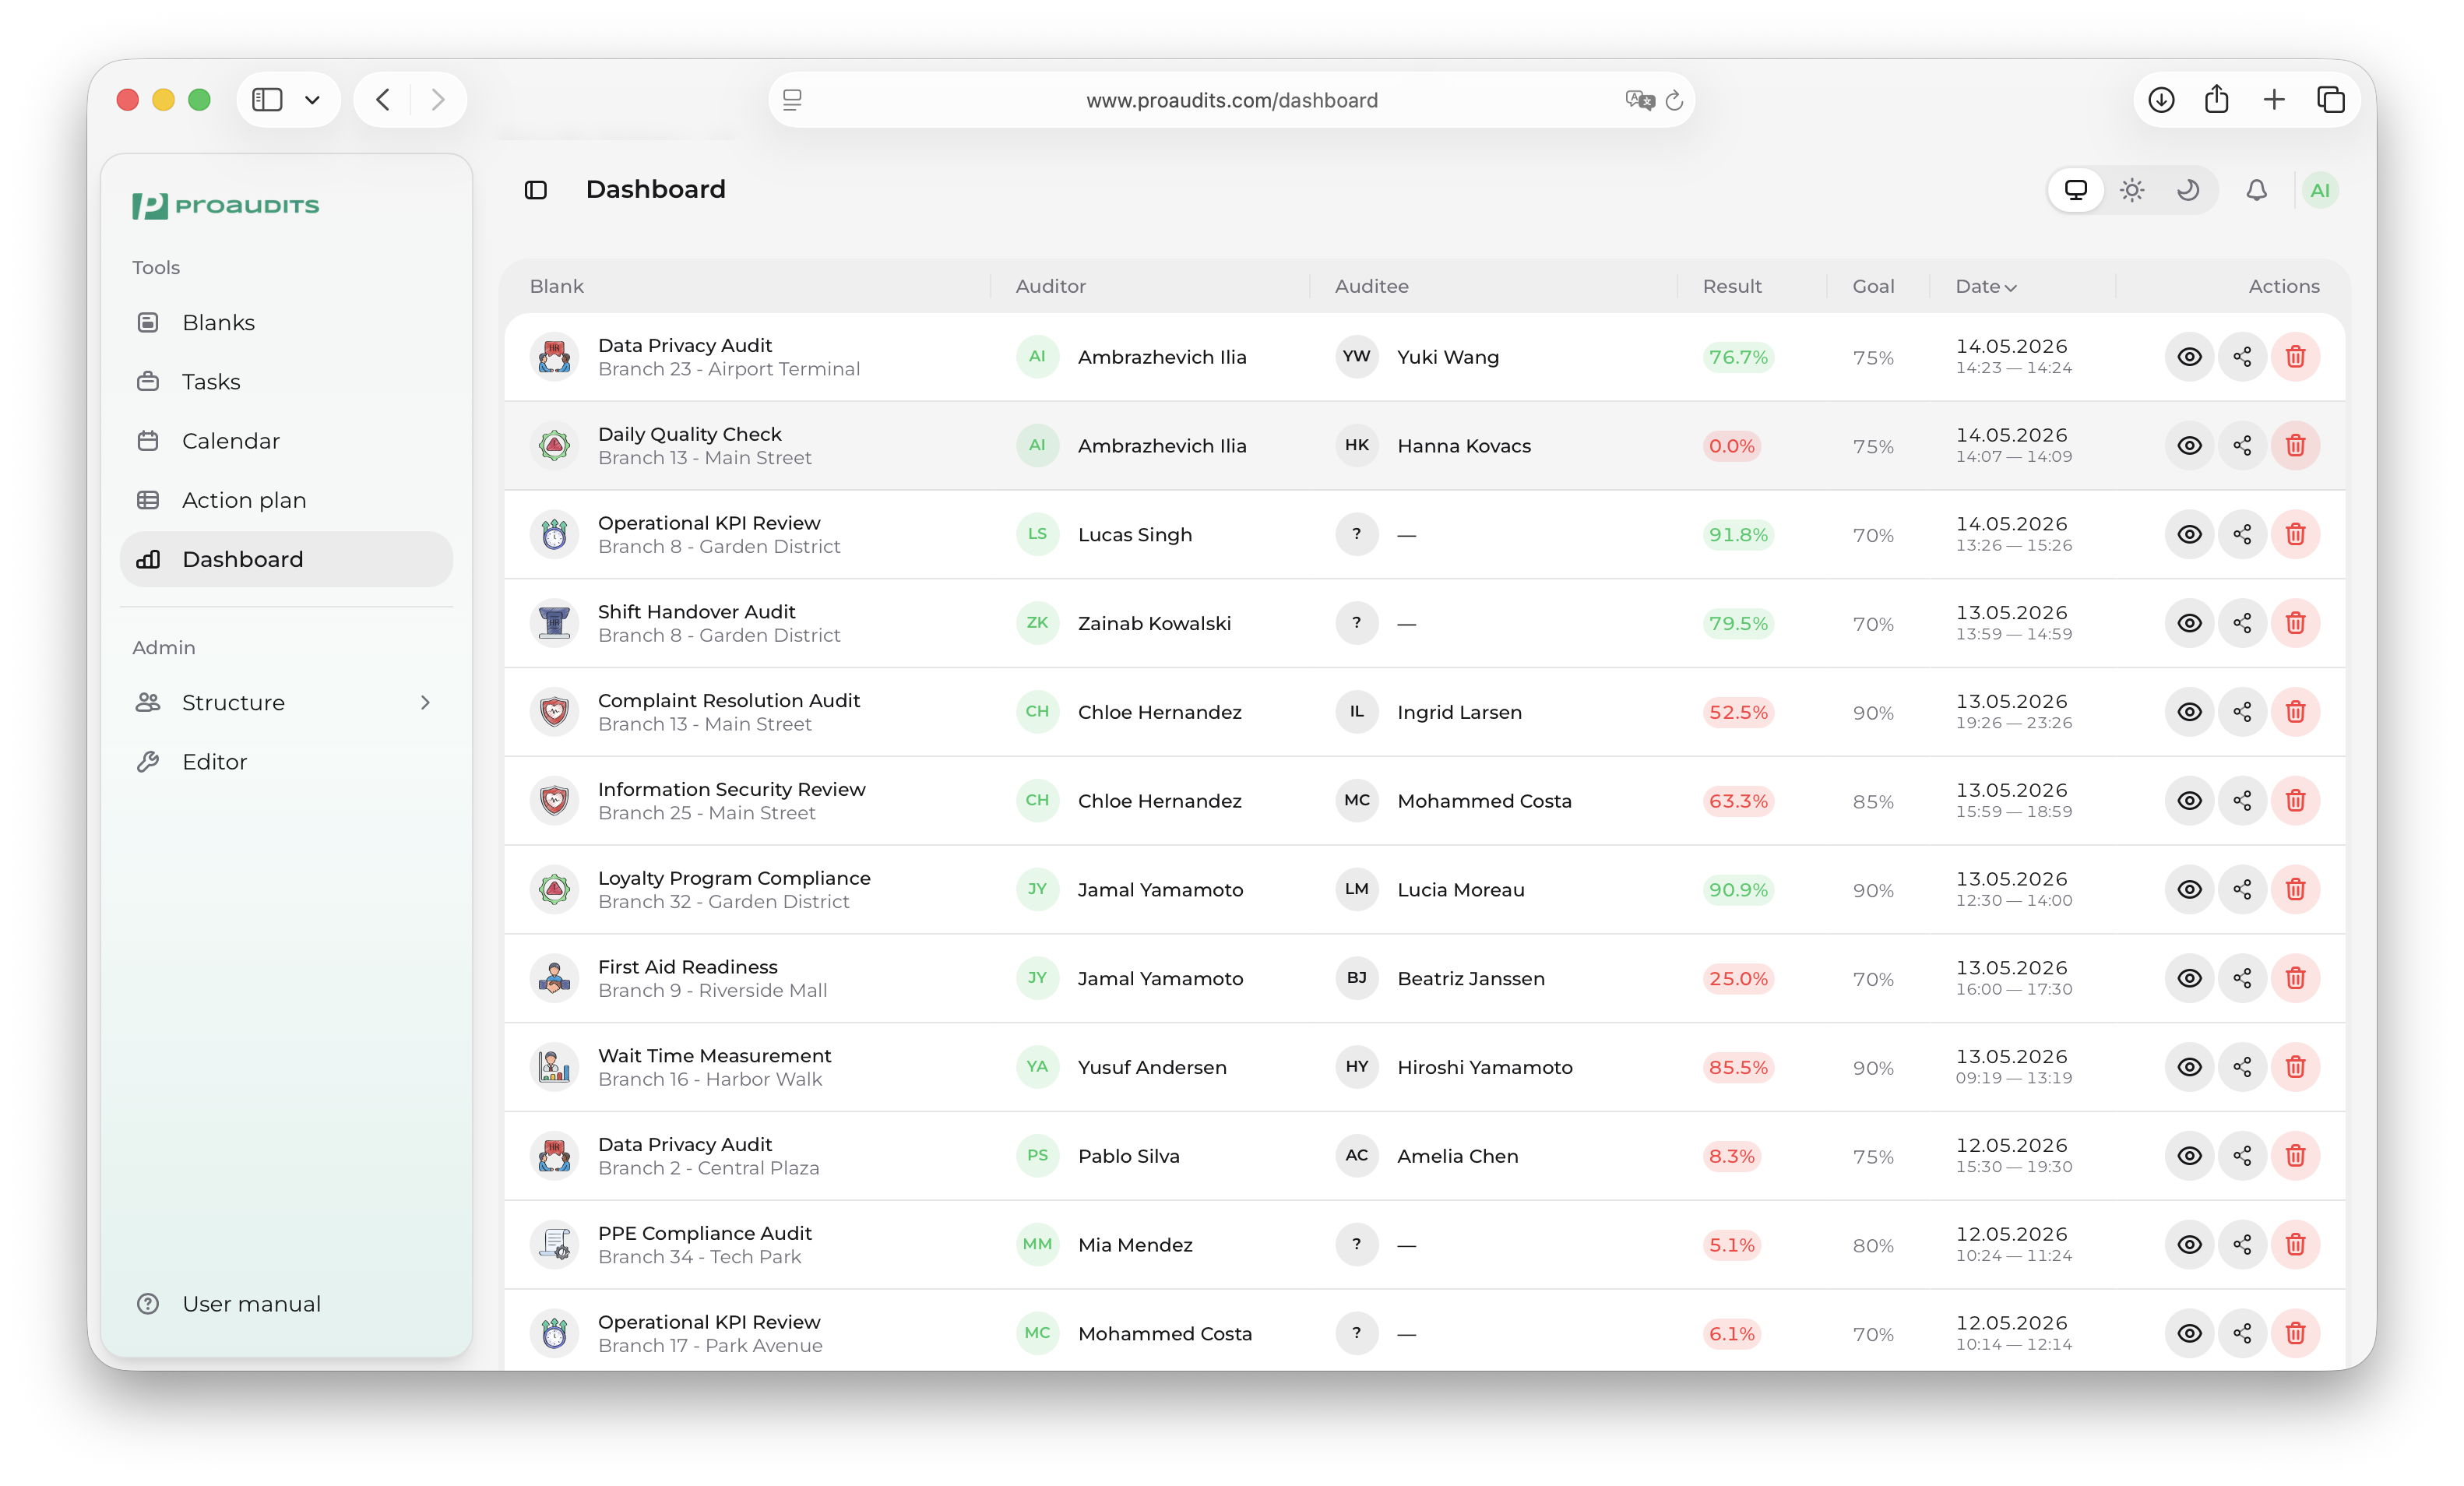
Audits history table
The list of every finished audit in the period. Each row shows:
| Column | What it shows |
|---|---|
| Blank | The template the audit was started from. |
| Auditor | Who ran it. |
| Auditee | The employee being audited. |
| Result | Weighted score percentage with a color chip (green ≥ goal, yellow below). |
| Goal | Target percentage for that blank. |
| Date | When the audit was finished. |
| Actions | Row-action menu (see below). |
Audits history table
The table toolbar offers:
- Search — full-text filter that matches blank, auditor, and auditee names.
- Sort — pick the column and direction.
- Columns — show/hide individual columns when the table feels too wide.
Row actions
The actions cell on each row exposes three things:
- View — open the audit in read-only mode.
- Share — opens a sub-menu with:
- Export to Excel — full data for that one audit as a spreadsheet row.
- Export to PDF — a printable single-audit report.
- Delete — soft-deletes the audit. Available only to roles allowed to delete finished audits (typically Admin).
Analytics tab
Deeper breakdowns. Open this tab when you want to know why numbers move, not just that they moved.
Analytics tab
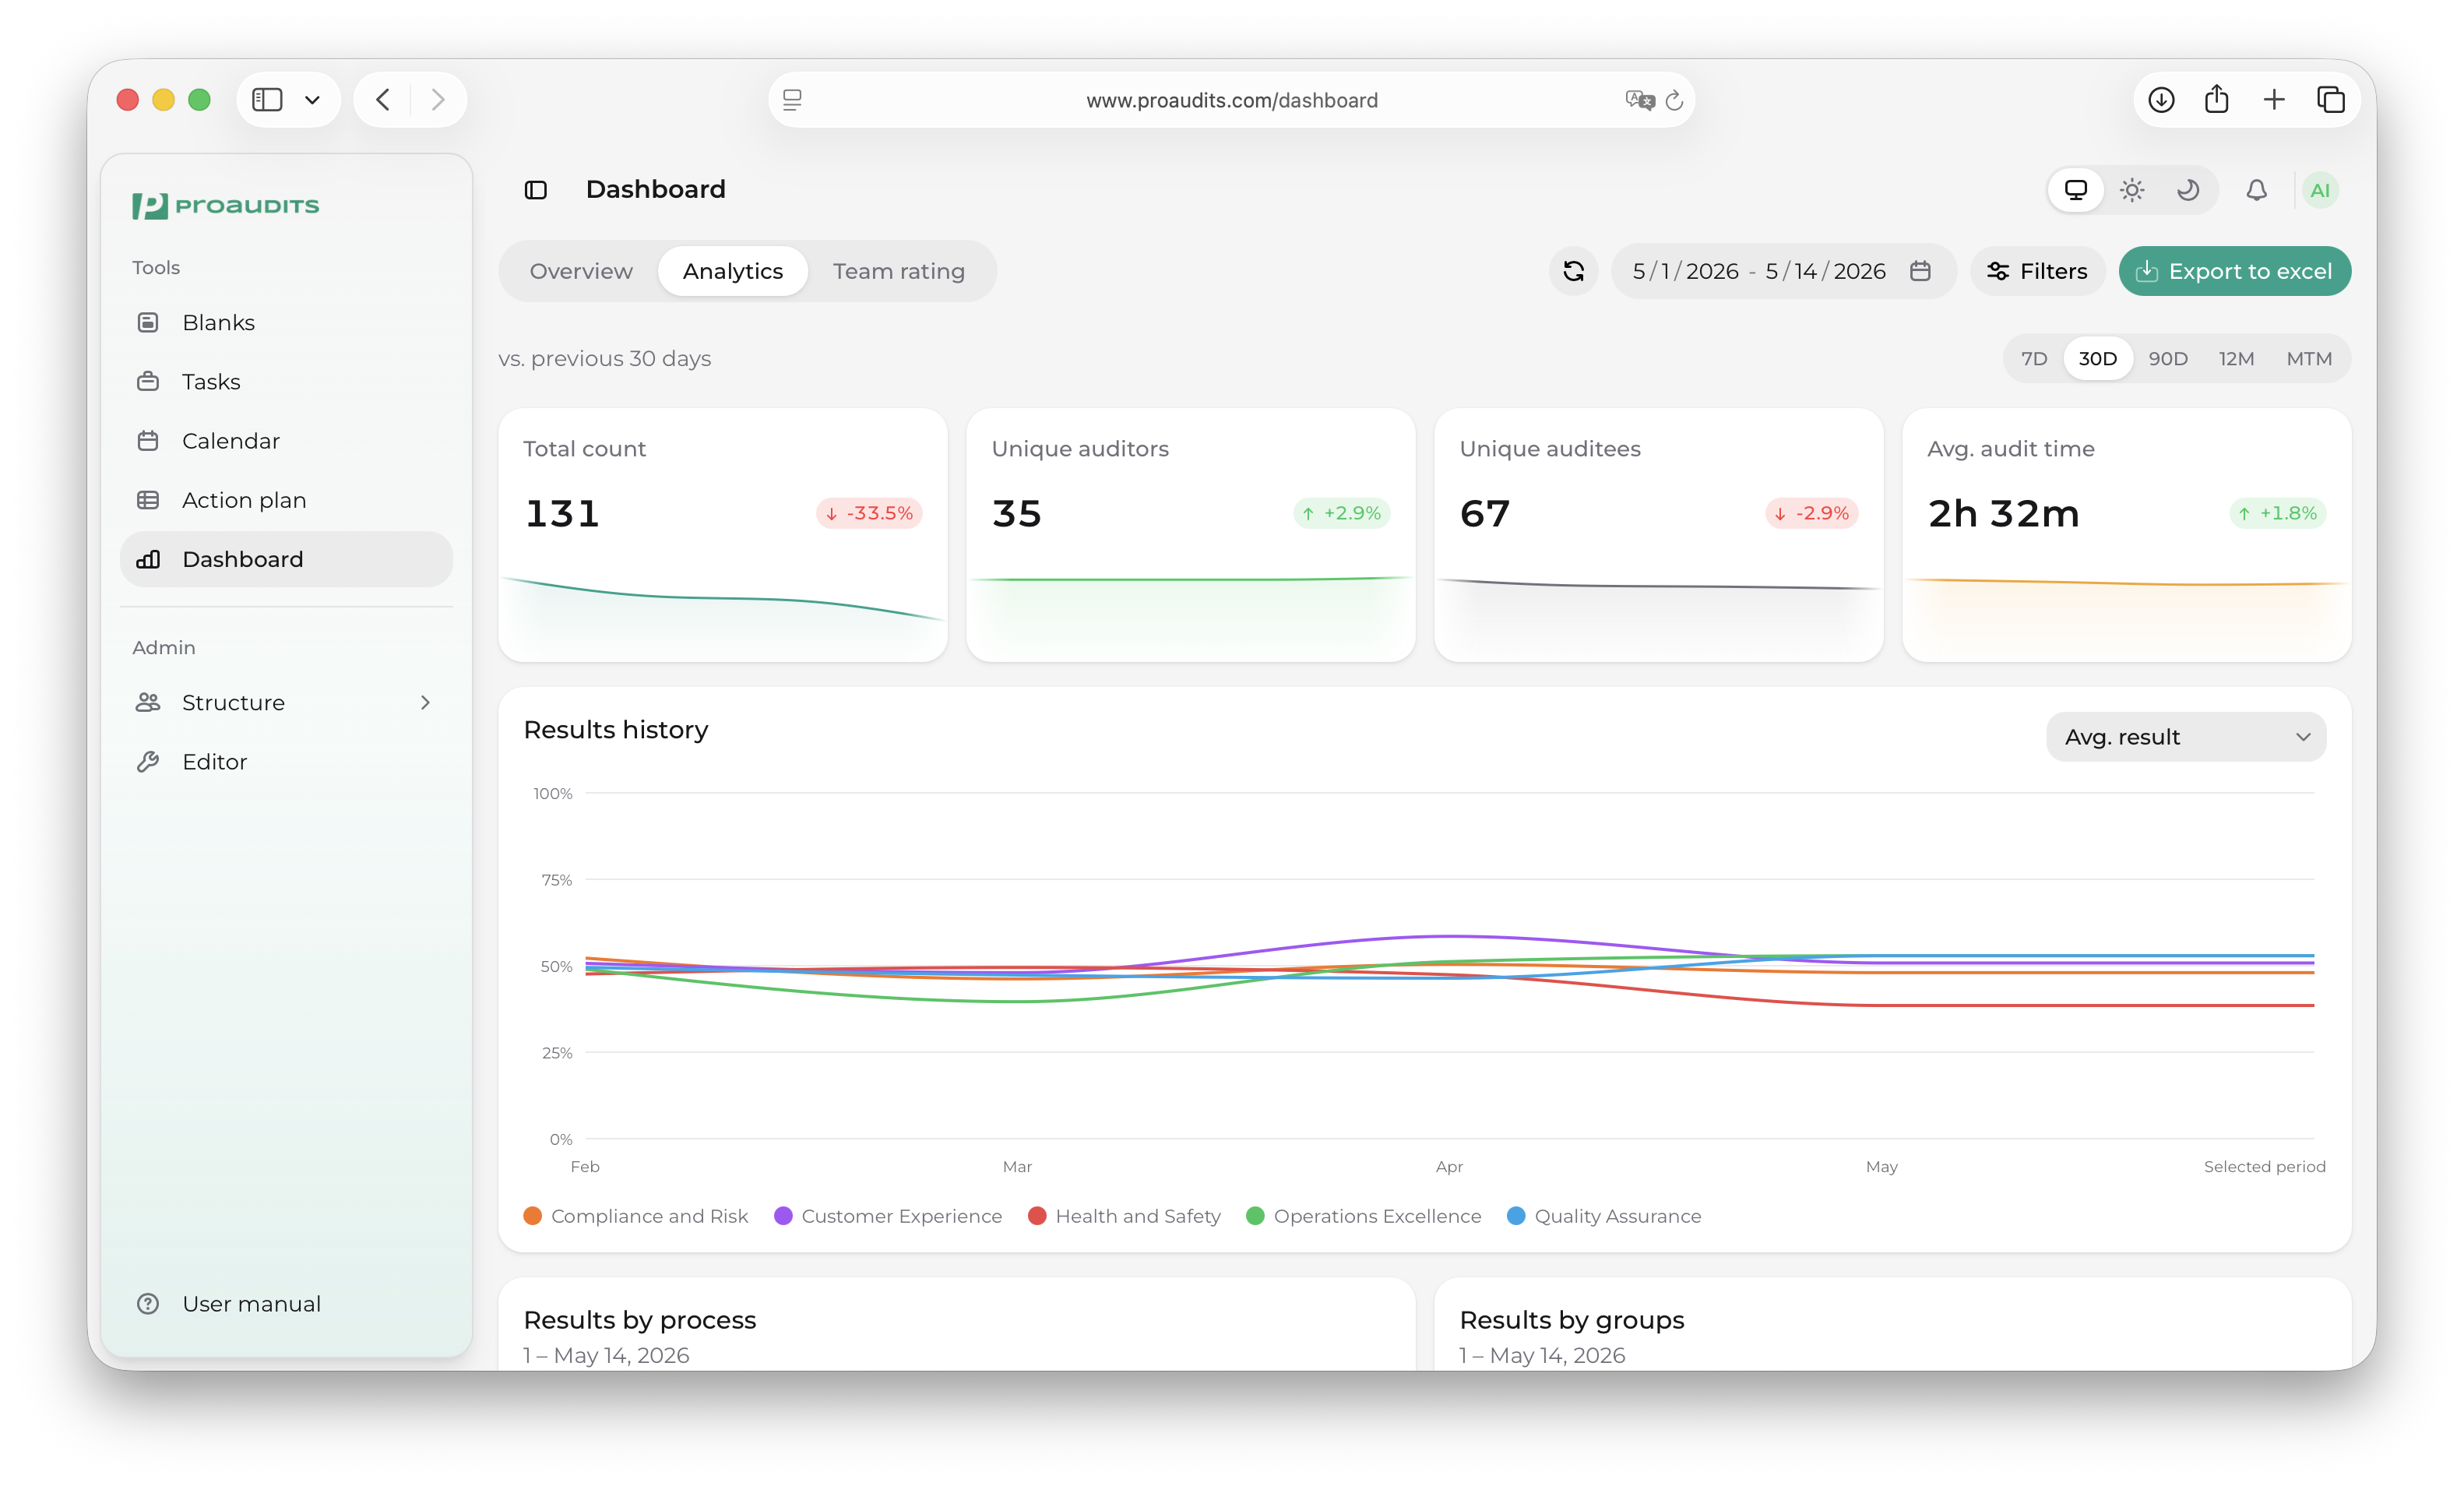
The Analytics tab adds its own range selector at the top — independent of the global filter — so you can compare, for example, the last 7 days against the last 30 days without changing your main scope.
Results history (Analytics version)
A larger version of the same line chart, with a toggle to switch the visible metric between Avg. result, Hit rate, and Total count. Use it when you need to zero in on one of those three.
Results by process
A radar chart with one axis per process — your team's relative strengths and weaknesses at a glance. The further out the polygon stretches on a process axis, the higher the average score for that process.
Results by process
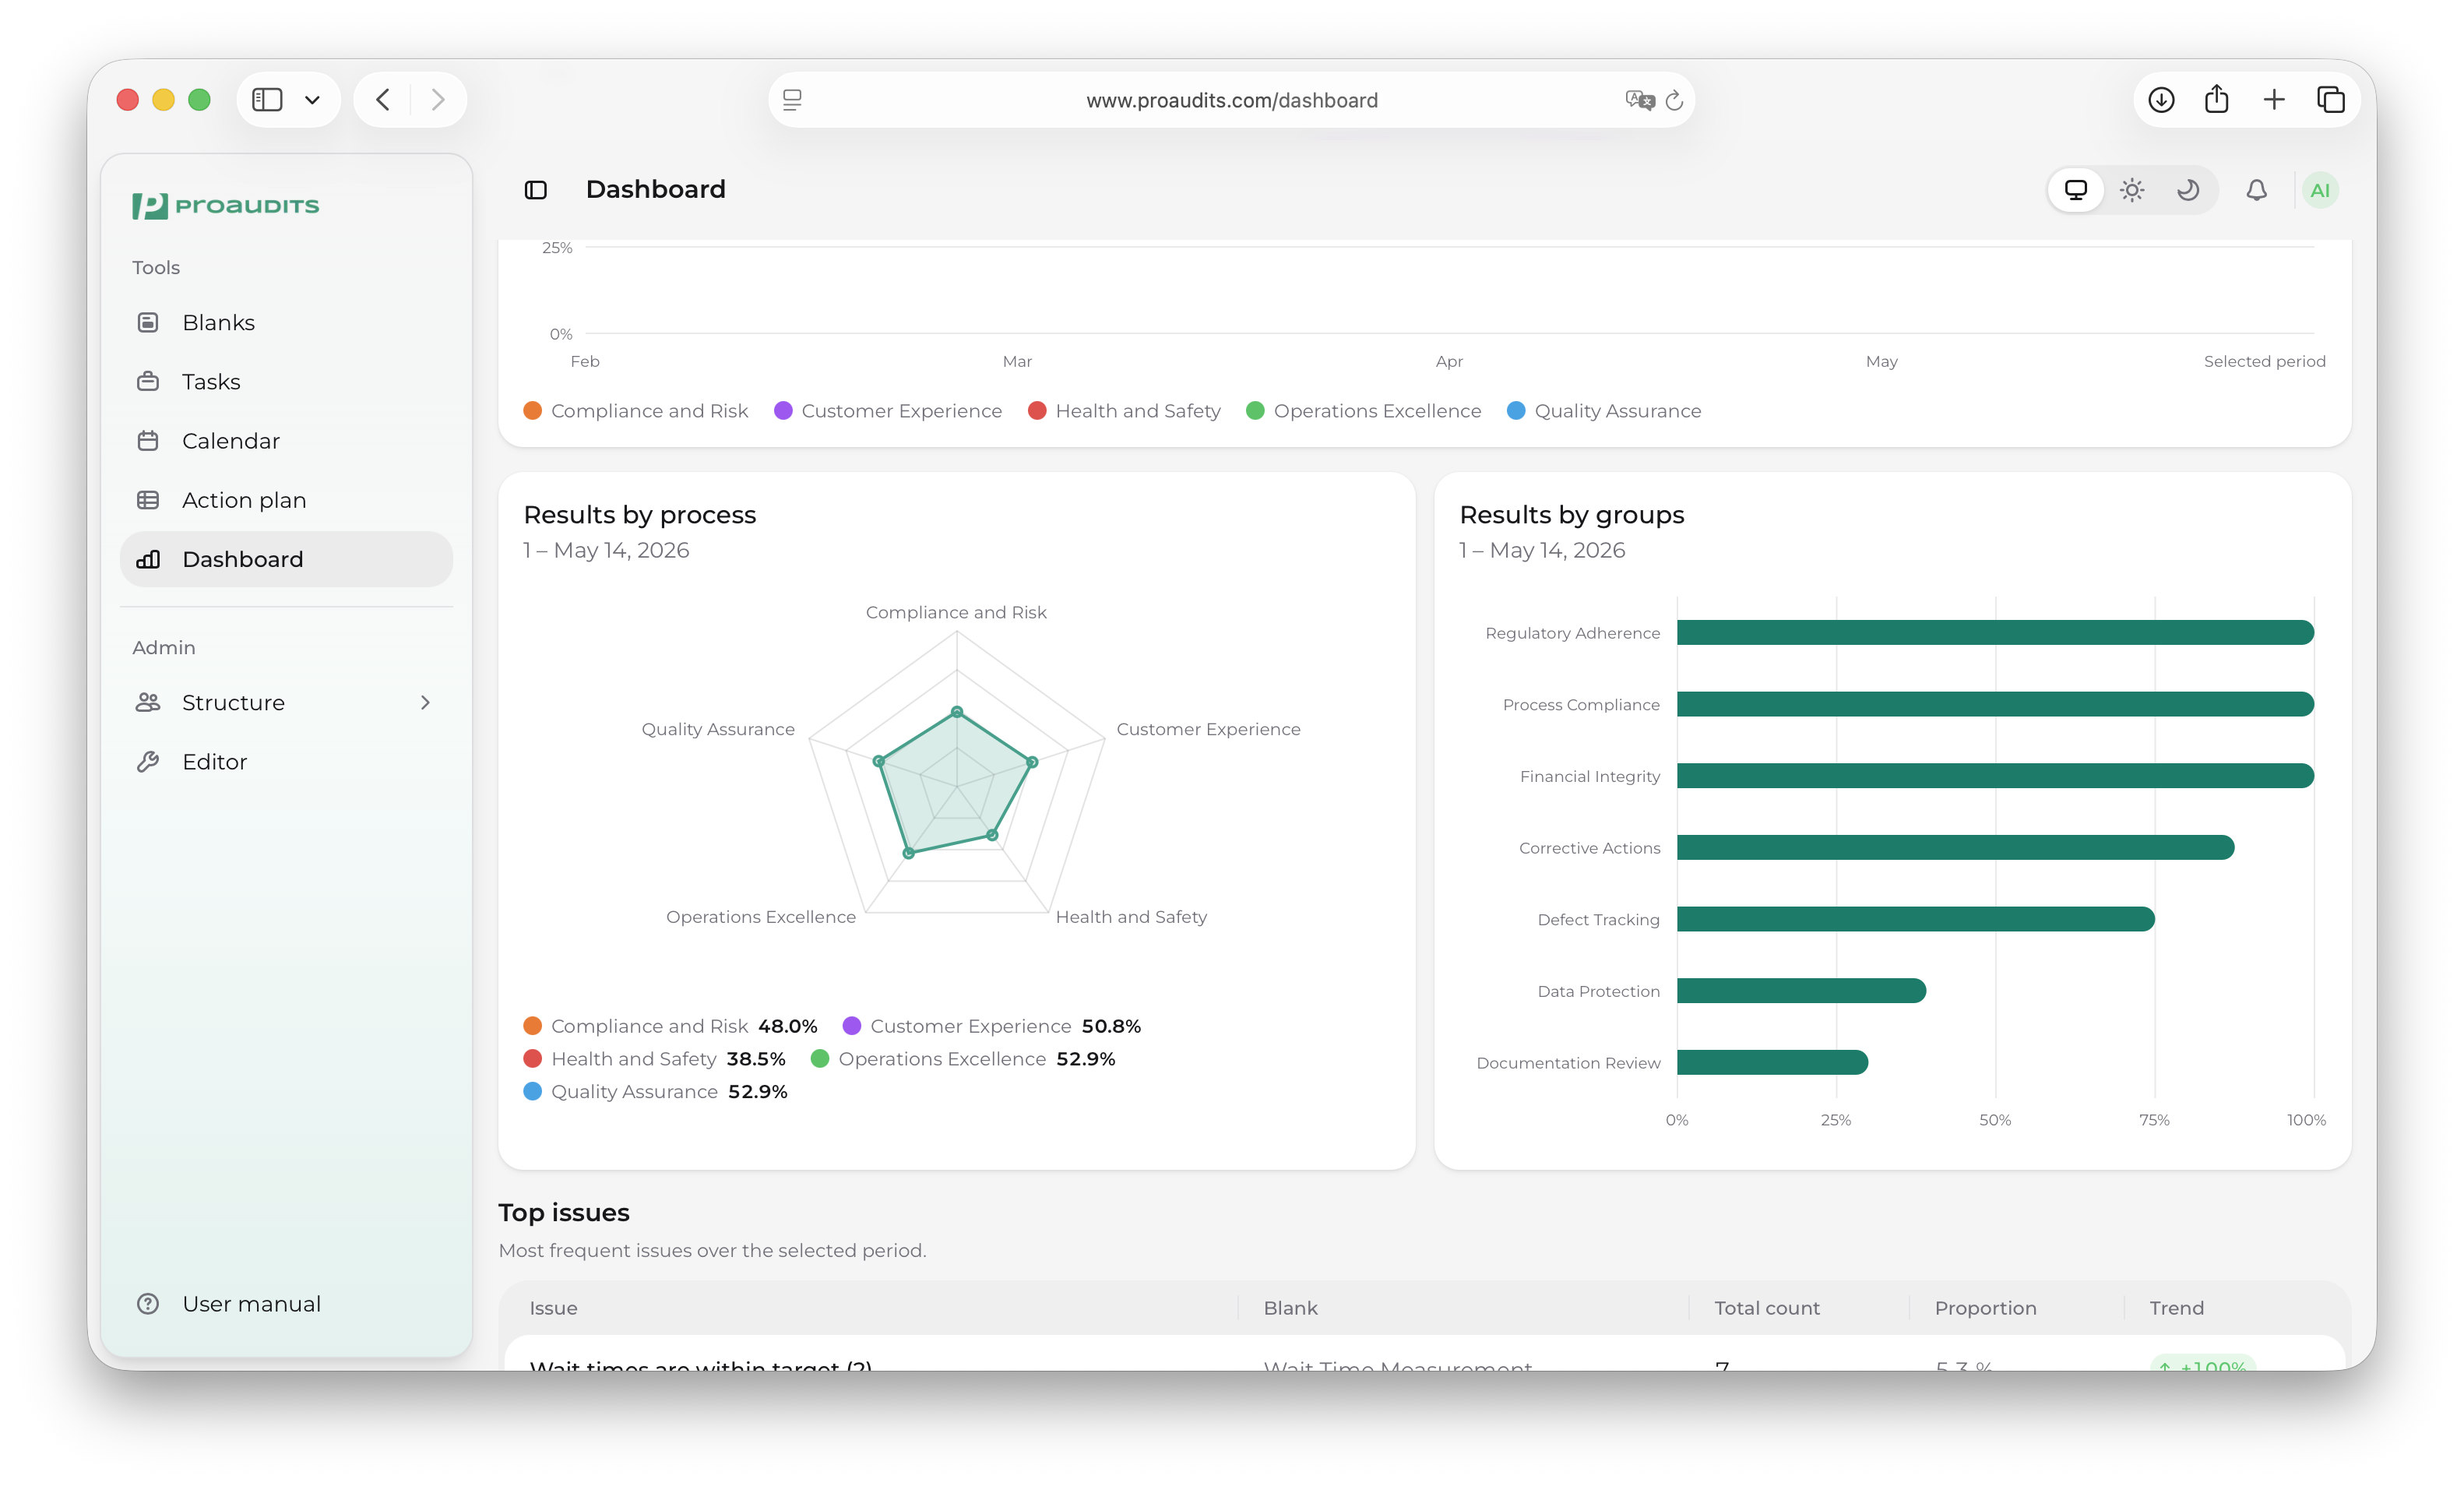
Results by groups
A horizontal bar chart of average result per item group (the sections inside your blanks), sorted from highest at the top to lowest at the bottom.
Results by groups

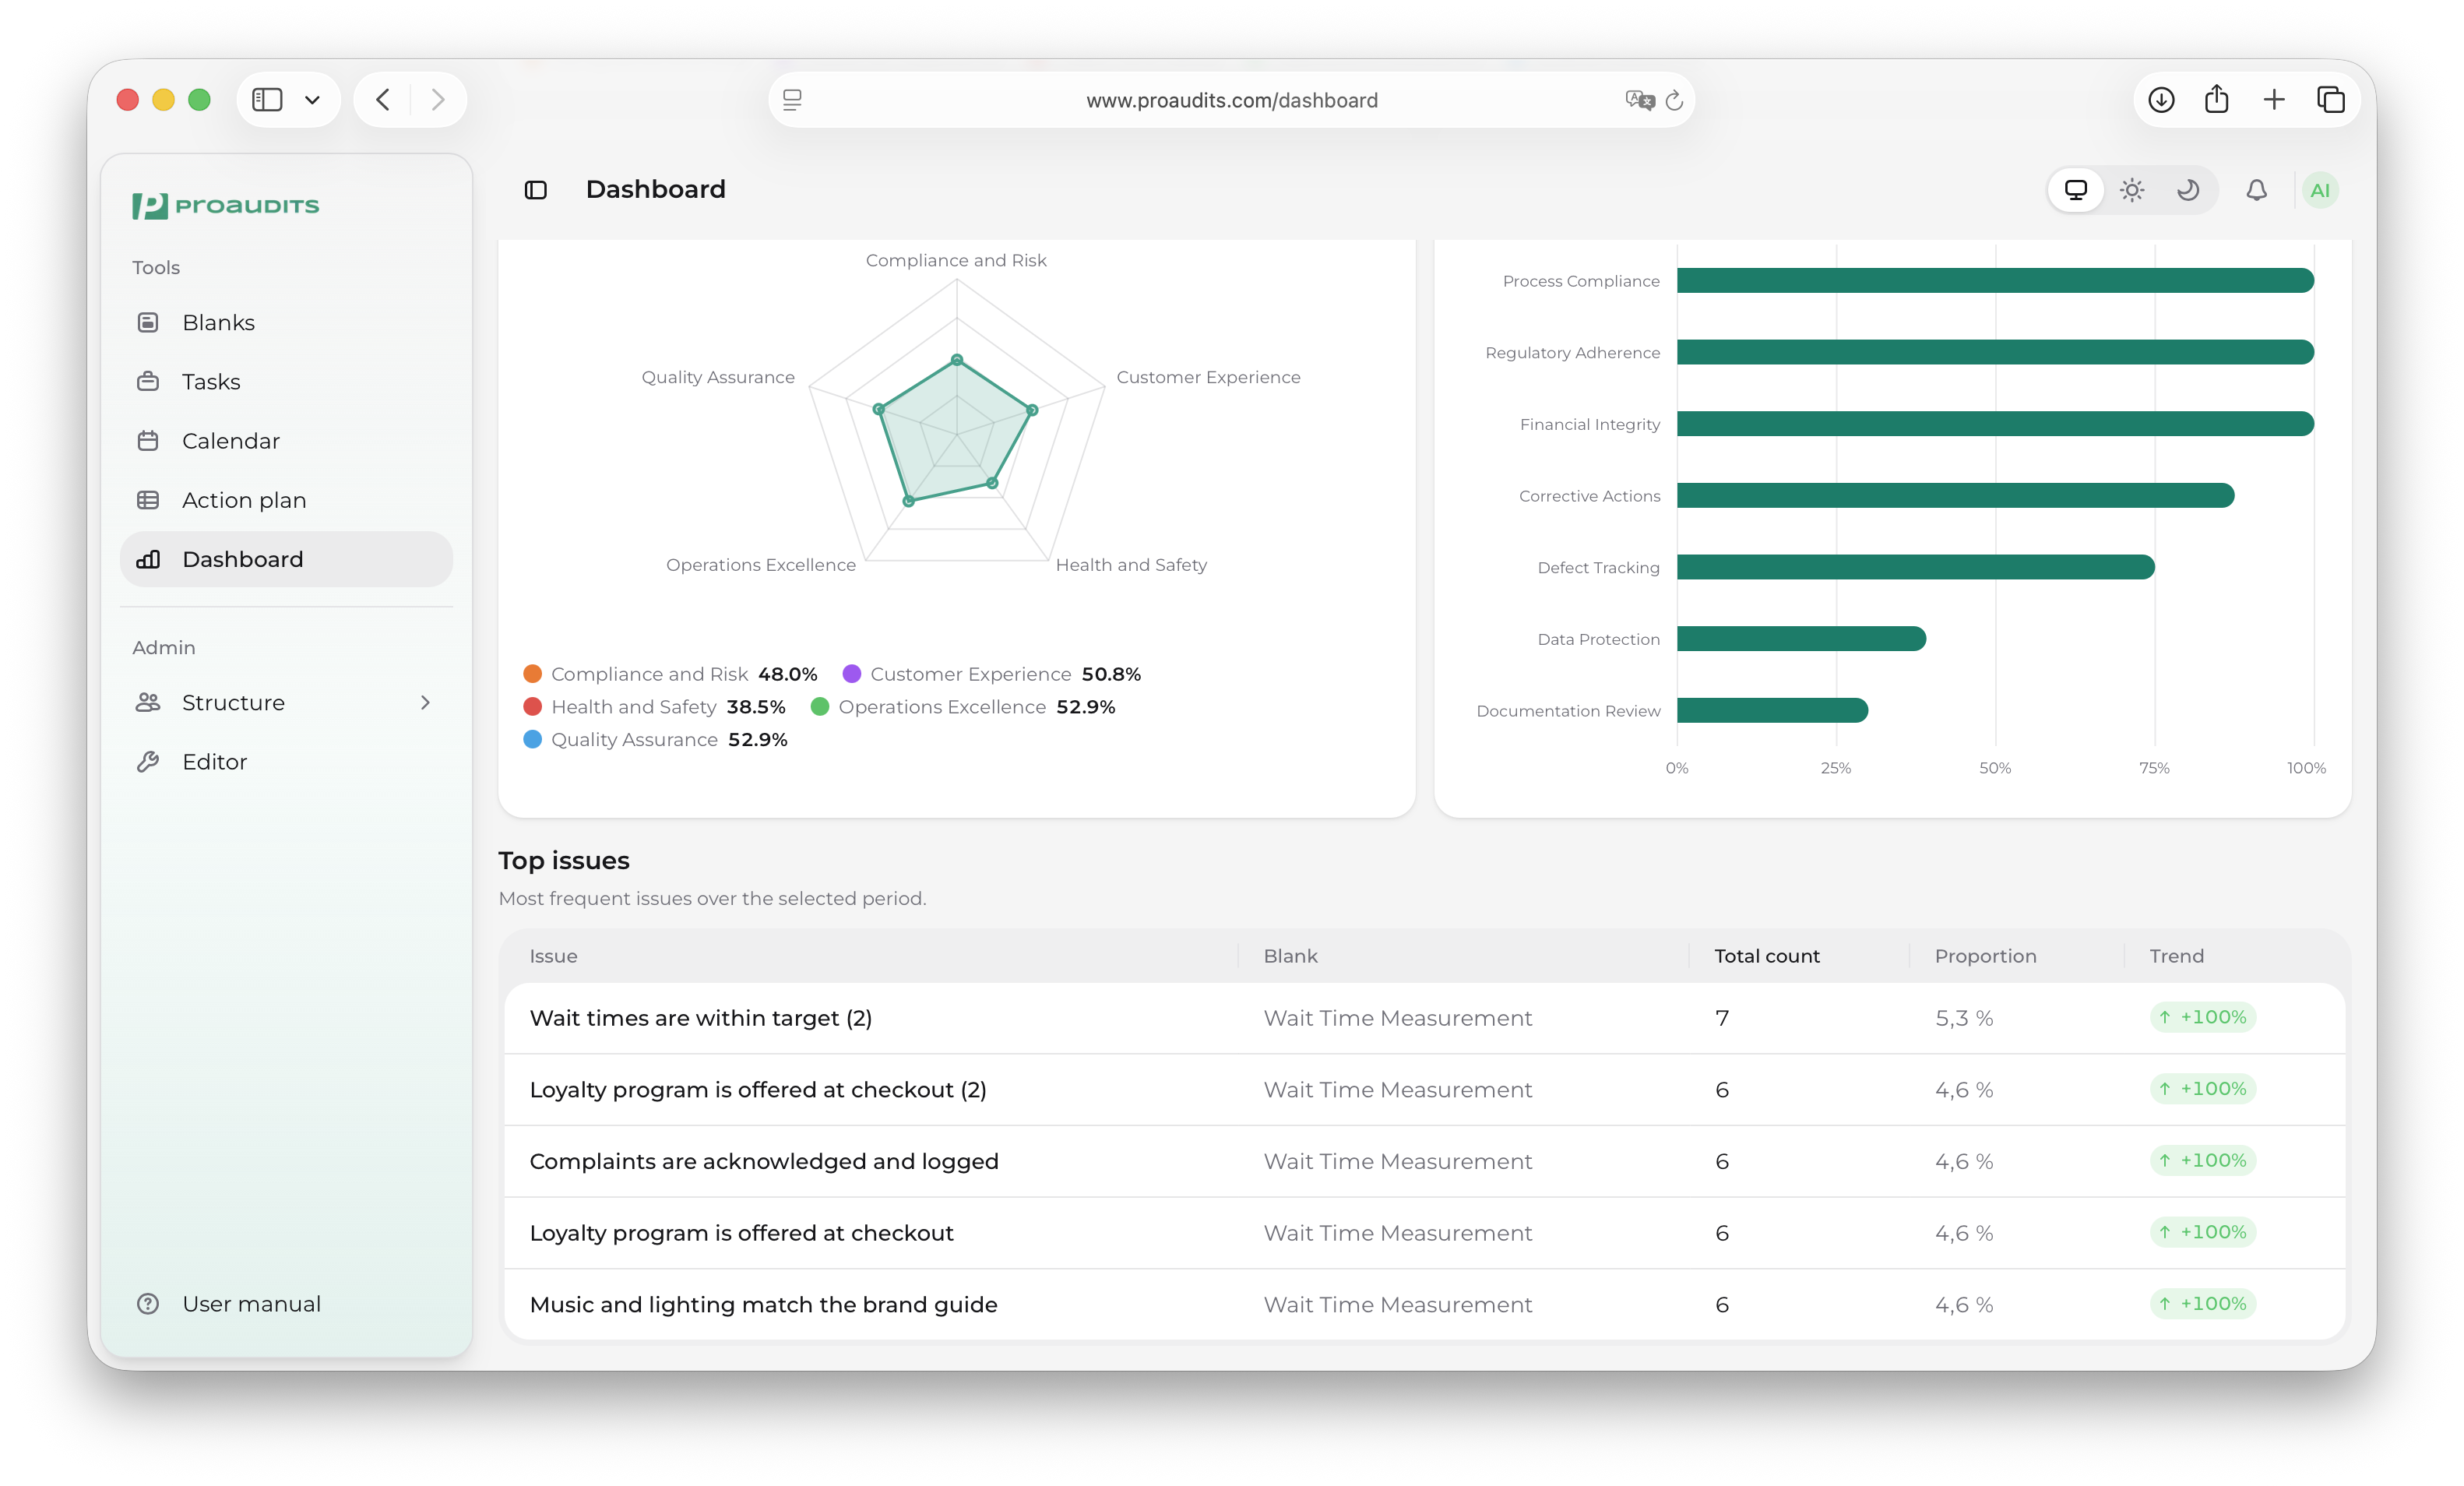
Top issues
A table of the items that fail the most across the period. Each row shows:
| Column | What it shows |
|---|---|
| Issue | The item text — "Fridge temperature ≤ 4°C", "Front door is clean"… |
| Blank | Which blank the item lives in. |
| Total count | How many times the item has been answered No. |
| Proportion | What share of all No answers in the period this item makes up. |
| Trend | Up / down vs. the reference period. |
Top issues table
A separate expansion panel breaks the same data down per blank and per auditor so you can answer follow-up questions like "which auditor catches this issue most?".
Team rating tab
The leaderboard.
Team rating tab
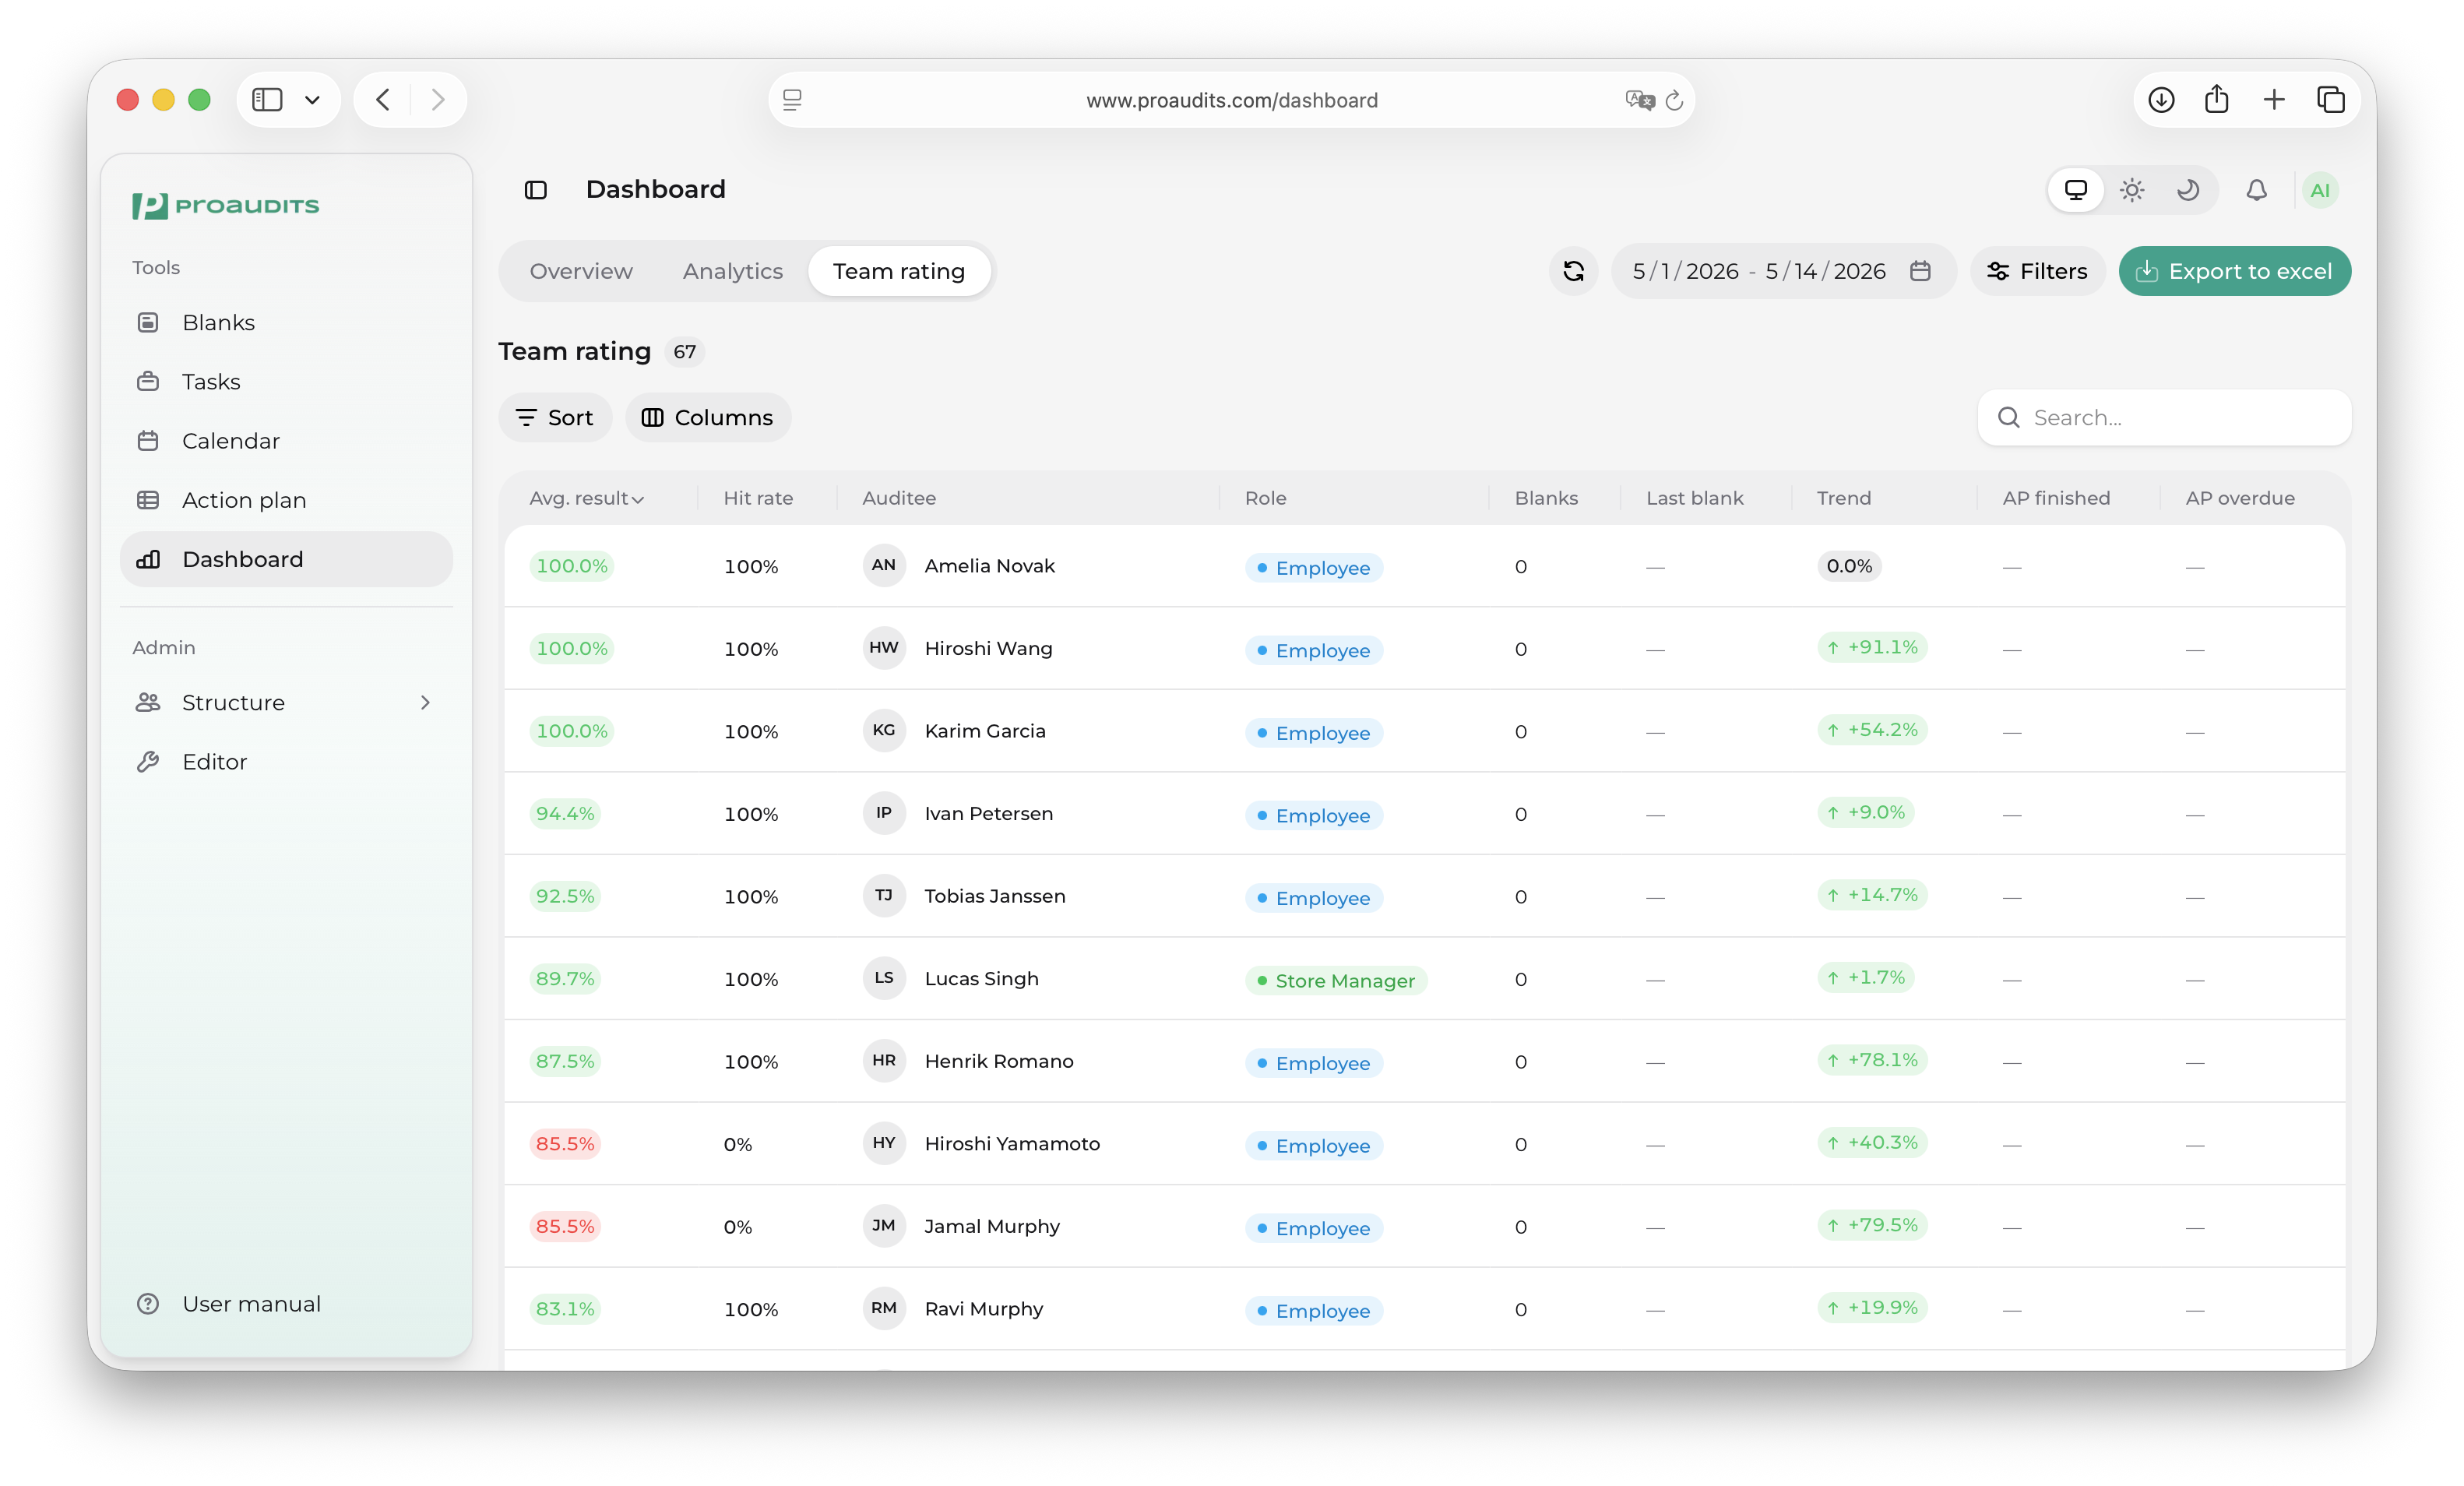
Each row in the leaderboard shows:
- Name and avatar.
- Number of audits run / received.
- Average score.
- Trend arrow vs. the previous period.
Use it for friendly competition, or to spot the auditor who needs coaching this month.
Refreshing and exporting
The dashboard reads from the same data as the rest of the app, but it caches for speed. Audits and action plan changes flow through within a few seconds; use the Refresh button in the toolbar if you have just finished an audit and want it in the numbers immediately.
Exports happen at the row level (from the audits history) — there is no "export the whole dashboard" button. To get raw data for further analysis, use Share → Export to Excel on the individual audit rows you care about.